Digital Alloys’ Guide to Metal Additive Manufacturing - Part 5
Economics of Metal Additive Manufacturing
January 31st, 2019

Cost is the largest issue gating adoption of Metal AM in production. Very little has been published on the costs of metal AM, and what has been published typically focuses on specific technologies or applications. In addition, many economic analyses of metal AM consider only the cost of raw material, ignoring significant costs associated with the printer, maintenance, operator, overhead, consumables, etc. Such analyses are often marketing ploys and – in our opinion - intellectually dishonest.
To promote metal AM as a real production manufacturing solution, we need a complete view of economics that will enable us to identify appropriate applications, select the best technologies, and successfully implement solutions on the factory floor. The goal of this post is to help fill the information deficit by providing a framework that can be used to compare the production costs of different technologies.
First, About the Data
It is said that to truly understand something you must actually do it. For this reason, most of the best knowledge about the economics of metal AM resides with the few companies that have done metal 3D printing at production scale. Most companies that have accomplished this see the operational knowledge as proprietary and protect it accordingly. We have done our best to extract it. The data represented herein is an amalgamation of our own experience, collaboration with customers and experts across the AM industry, and research from services bureaus, and printer and material vendors. For new and emerging technologies that have not been fully “field tested” yet, the data typically comes right from the OEM and must be taken with a grain of salt. .
Scope, Methodology, Assumptions
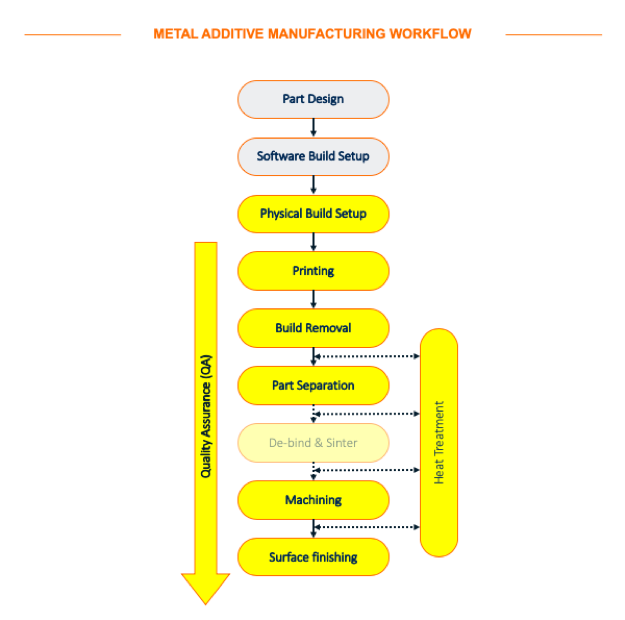
There are many steps in the whole Metal AM workflow. This post focuses on the steps that occur after the part to be printed is designed. The economic model assumes that print batches (“builds”) have been optimized for printer throughput and material use through careful design of part geometry, supports, print orientation and build layout (nesting). We note that the economics of production print batches are different than the low volume prototype builds typical in today’s 3D metal printing. We selected Titanium (6Al-4V) for our analysis, as this is one of the most popular materials in production metal AM.
Data for each metal AM technology was gathered from a range of inputs. In cases where the data had a wide range, we used averages. For some technologies, cost inputs vary with part geometry. In these instances, we chose data from case studies for part types that fit well with each technology. Many variables contribute to the economics of metal AM, e.g., the specific equipment and utilization, unique part geometry, quality requirements, yield, and labor rates. Assumptions and generalizations were required to derive the economic results presented in this post – we tried to be as objective and consistent as possible. The most significant cost drivers and assumptions are explained below.
Facility costs, general administrative costs, and other general overhead line items were not considered for this study. These costs are usually insignificant when running a printer at high productivity, and are similar across printing technologies.
Cost Drivers
After a part design is complete, there are three main cost drivers in metal AM:
- Printing
- Material Consumption
- Post-processing
Each of these cost categories includes multiple sub-categories, outlined below. Comparing metal AM technologies across these three main categories is an excellent way to start understanding the distribution of cost and opportunities to improve economics.
1. Printing
Per-unit printing costs are a function of the operating costs and printer productivity. The below table contains a range of values for different types of printing equipment and a range of utilization rates. Some simple equations were used to calculate the per-unit printing costs:
Per-unit printing costs = Operating Costs / Printer Productivity
Operating costs (annual) = Annual Cost of Printer + Maintenance + Operator
Printer Productivity (annual) = Print Speed x Annual Printer Utilization

The largest operating cost is the printer. The price tag for Industrial metal printers can range anywhere from $200k to $2M+. They typically have a useful life of 5-10 years. For this model, we assumed a conservative life of 5 years. The next contributor is usually a comprehensive warranty and service contract which costs about 10% of the price of the printer, annually. Lastly, operator cost was estimated at average US manufacturing rates assuming the operator was managing a fleet of printers so their time could be divided. Processes with long print times (e.g. laser powder bed) allow for a higher ratio of machines per operator.
The most important factor in printer productivity is the volumetric print speed. Print speed is unique to each printer, material and build (part geometry and layout dependent). It can range from as little as 25 cc/hr for the slowest laser powder bed prints, up to 1000 cc/hr for binder jetting* and wire-based printers (DED, Joule Printing). To determine total annual printer productivity, the print speed is multiplied by annual utilization (print hours per year). The annual utilization takes into account downtime for maintenance and repair, time to load and unload part builds, and a two-shift structure with weekends and holidays. Average print time ranges between processes from just a few hours to around a week so this has a large effect on utilization rates. If a printer can be run for a week at a time then 4,000+ hours of printing per year can be achieved. If the printer must be loaded/unloaded every few hours it is likely closer to 2,000 hours per year.
* Binder jetting process speed is based on marketing materials from HP and Desktop metal. We adjusted the speed to account for a realistic build volume packing density of <10%.
2. Material Consumption
Material costs can be subdivided into printed material, waste material, and consumables.
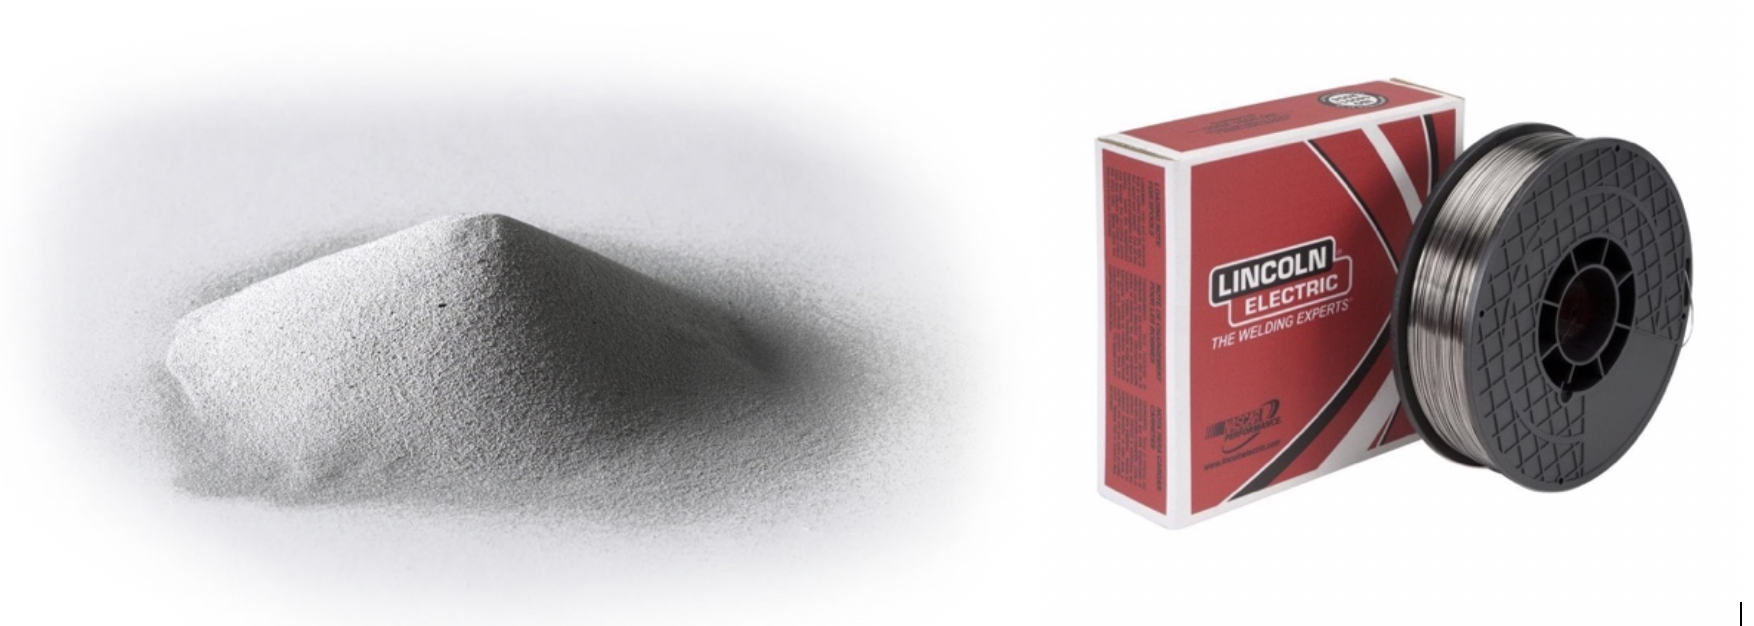
The metals used by 3D printing processes vary significantly in cost due to format and quality requirements. Titanium can range from $100/kg for a production volume of thick wire to over $500/kg for high-quality powder. Laser powder bed processes require small and highly spherical powders which are expensive to produce, typically ranging from $300-$500/kg for Titanium. E beam, powder DED, and binder jetting processes have lower requirements on powder quality, shrinking powder costs by about 50%. Wire is the most affordable (and abundant) option since it is consumed in huge volumes by the welding industry. For wire-based systems, Titanium wire will usually range from $125-175/kg.
Note: Some equipment manufacturers require that you purchase “sole-source” material from them at huge margins. Others have “open” material systems that allow you to purchase from 3rd party material vendors at much lower costs. This should be a serious consideration when selecting equipment.
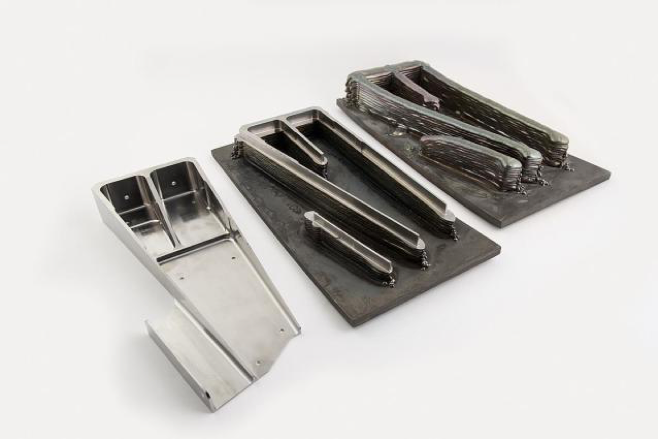
The printed material cost is calculated by multiplying the material cost by the volume or weight of the printed part (including supports, near-net-expansion, sacrificial structures, etc.). The process and part design strongly impact material waste. Low-resolution processes with large deposits, such as wire DED (5-20mm wide), produce oversized near-net-shape parts with a lot of excess material printed on external surfaces. Also, these processes cannot produce overhanging geometry (see Design Rules post
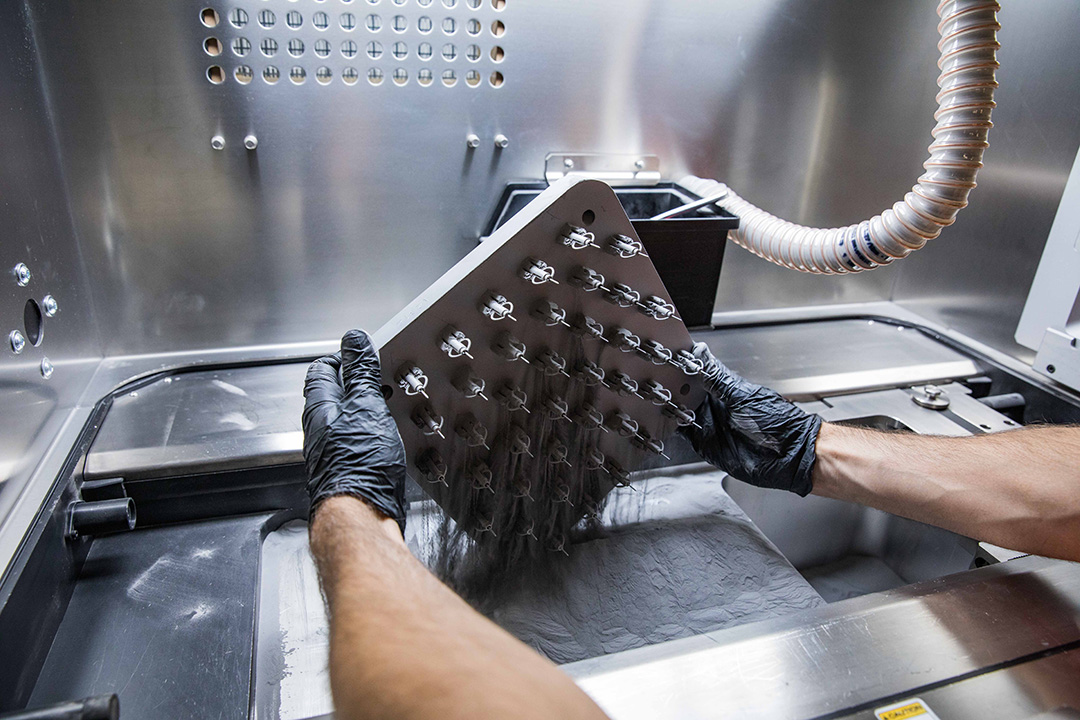
In powder base processes, waste material is powder used in the build that is not used in the part but cannot be reused. This waste can be very impactful to the bottom line. Powder bed processes require a full build volume of powder to print (sometimes over $100k of Titanium) and some processes require that up to 50% of this volume is “virgin” (completely new) powder. This means that if 10% of the full build volume is actually printed metal (fairly typical in production) then up to 40% of the build volume is filled with powder that will be wasted. This can be an extraordinary cost with metals such as Titanium which are very inefficient to recycle. Optimizing “pack-density” (how tightly parts can be nested together in a build layout) to reduce waste material is very important for improving the economics of powder bed processes.
Consumables refer to all of the non-print materials and non-reusable components required by the printing process. Consumables are too often overlooked in crude economic models, but their costs can add up fast. Each process has its own consumable needs. For example, in binder jetting processes the binder is an expensive consumable that is used in large quantity throughout the printing process. Most processes require inert gas to purge the build chamber and sacrificial metal plates on which to print. All of these costs must be accounted for.
3. Post Processing
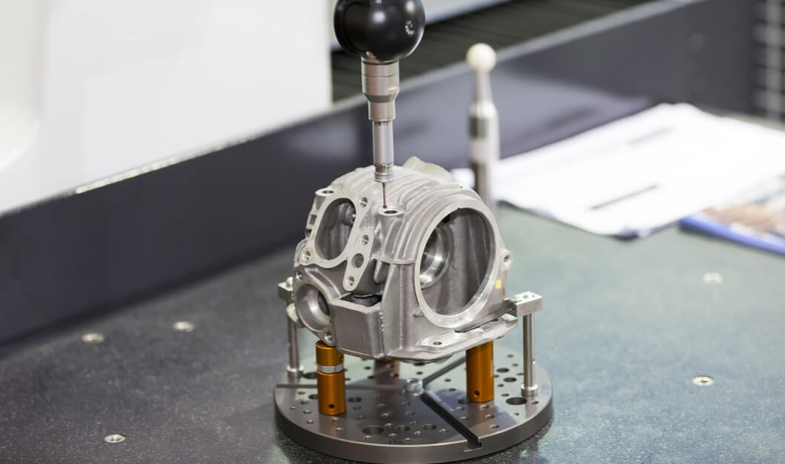
Post processing can involve several steps: part separation and support removal; heat/pressure/solution treatment; surface finishing (e.g. machining, shot peening, etc); and QA.
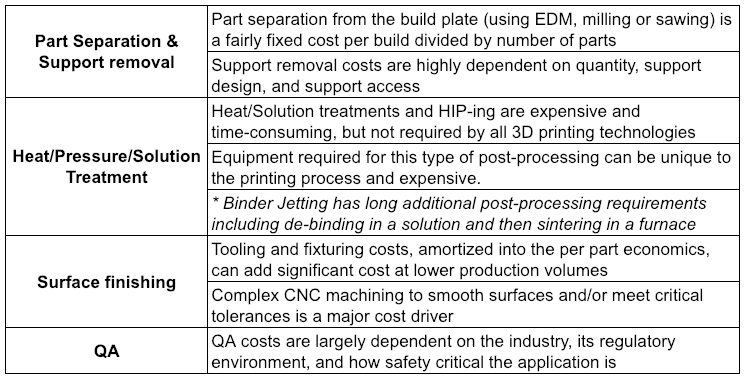
Post processing can involve several steps: part separation and support removal; heat/pressure/solution treatment; surface finishing (e.g. machining, shot peening, etc); and QA.
The number of steps and their costs are extremely dependent on program details and application requirements. Post-processing can easily become the largest cost component for certain applications.
For the purpose of this model, QA Costs were broadly estimated at +10% of all the other post-processing costs. This may be an inadequate budget for many lower quality processes and/or applications with high-quality requirements.
It is worth mentioning that powder binder jetting processes involve unique, additional post-processing steps to remove the binder and sinter the part in a furnace. This added equipment and operational costs are estimated and amortized into the post-processing unit economics.
Yield
Manufacturing yield – the percentage of output units that meet quality requirements - can have huge implications on cost. For the purpose of this study, a 90% yield was applied to all technologies. This factor is very sensitive to the specific process and geometry as well as the stringency of application requirements. There is not yet enough industry data on yield across metal AM technologies, but this should an important factor to consider.
The Results
Below is the output of our cost model for 6 prominent metal AM processes. The charts are presented in cost per volume (cc) and weight (kg) of the final part.
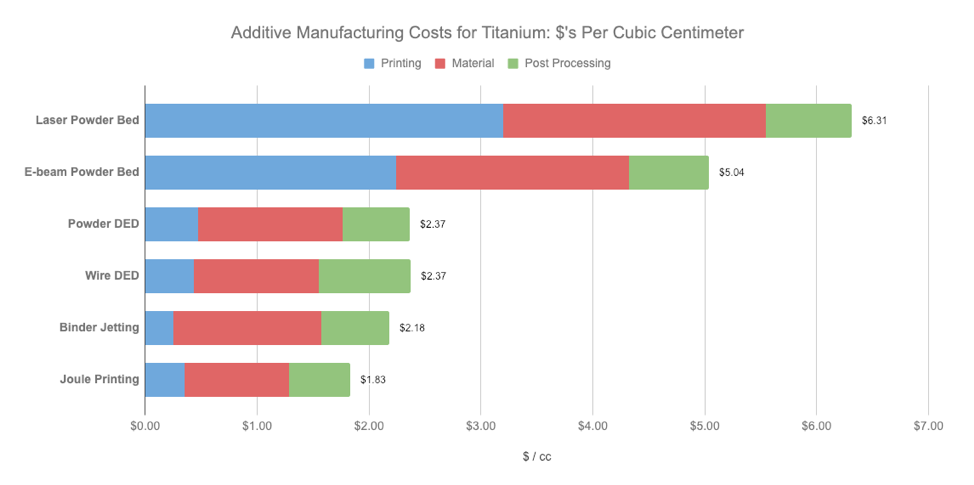
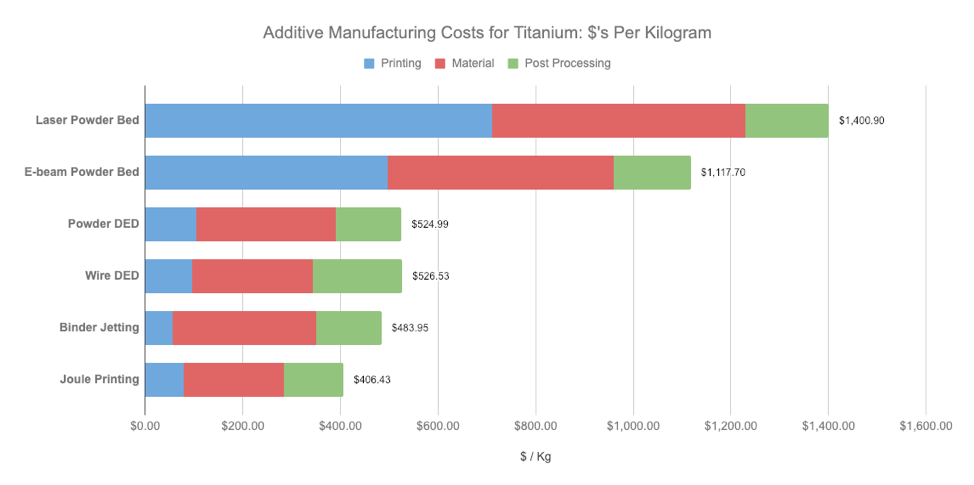
For laser and e-beam powder bed processes, the printing represents the largest cost driver. For faster processes: DED, Binder jetting and Joule Printing technologies – raw material cost is the dominant factor. The range of unit costs from the most expensive to the least expensive technology is more than 3.5x, a significant range in the manufacturing world.
It is also important to point out that these costs are based on vertical integration of a printer within a company’s manufacturing operations. If parts are ordered through a 3rd party (aka service bureau), you can expect a 25-50% margin to be added.
The Future
How will costs evolve over time? First, there are a lot of opportunities for automation to reduce post-processing costs and improve quality and yield across the board. Few metal AM production programs have invested in automation because the investments don’t pay off at relatively low volumes. As more and larger scale metal AM programs enter production this will help drive down the right side of the cost curve. A lot of the powder bed and DED processes are fairly mature at this point but Binder Jetting and Joule Printing technologies are both more nascent and have a lot of potential to further reduce costs through increased print speed, lower material costs, increased yield, and more.
Build your own!
It is imperative that every manufacturer develop their own unique metal AM cost model to match their businesses manufacturing operations, equipment capabilities and the specific application and quality requirements. Our model and results were intended to provide an early indication of economic feasibility but do not replace the need to build a detailed business case for your own application. This is something Digital Alloys works closely with our customers on for each unique program and application.
Please leave your email below if you would like to be updated as we release future articles in our Guide to Metal Additive Manufacturing.
Please check out other posts in our blog series,
Digital Alloys’ Guide to Metal Additive Manufacturing
Learn about the technology behind our process,

Alex Huckstepp
VP Business Development

Digital Alloys is committed to providing the technology and expertise manufacturers need to use metal additive manufacturing in production — enabling them to save time, shrink costs, and produce valuable new product.